In this post I present an original concept of labyrinths and explain how they can be programmatically generated.
For some time now I have been designing labyrinths based on traffic lights, like this one:
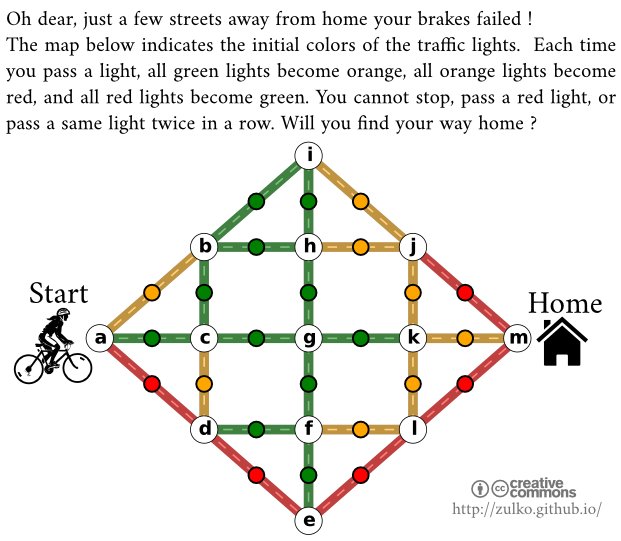
I call these Viennese mazes (long story) and since I couldn’t find anything similar on the Web, I assume that this is something new. Here are some more with other shapes, and their solutions.
These mazes are very difficult to design by hand, and this post is about how to ask your computer to do the work for you. We will see what a good Viennese maze is made of, and how to generate one using a simple evolutionary algorithm.
Viennese mazes are (a special kind of) normal mazes
My first intention with Viennese mazes was to make dynamic mazes, with moving walls. But under each Viennese maze there is actually a standard, old-school labyrinth.
To see this we must think in terms of states. A state describes where you are in the maze, and determines where you can go from there. In the maze above, state (c,1,a) means “I am in (c), I have passed 1 traffic light until then, and just before that I was in (a)”. From this state you cannot reach (d) as the light in this street has turned red, and you cannot reach (a) because you just came from here. But you can move to (b) or (g), that is, to state (b,2,c) or state (g,2,c). Note that states such as (c,1,a), (c,4,a), and (c,7,a) are actually the same state, because afer three moves all traffic lights come back to their original position. So there will always be a finite number of states in a Viennese maze.
If we draw a map of all (reachable) states and their connexions we obtain the following states graph :
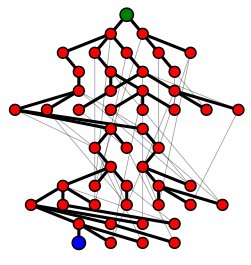
The green node marks the starting point, while the blue node is a reunion of all states corresponding to the goal (m). The nodes on the $i$-th line from the top can be reached in $i$ moves but no less, thick lines go downwards and thin lines go upwards.
This graph looks like a classical labyrinth, with crossroads, dead ends, loops… at one glance it gives an idea of the complexity and interestingness of the original Viennese maze. Therefore, we will consider that a good Viennese maze is a maze whose states graph makes a good labyrinth.
What makes a good labyrinth ?
Here is an illustration of a few criteria which make a labyrinth insteresting :
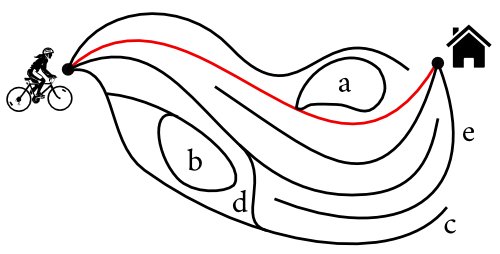
- There must be a unique solution, the longer the better. In Viennese mazes It will be difficult to avoid loops like the one in a, where you leave the right track at some point and join it back later at exactly the same position. But there should be a unique mandatory path to the goal (in red in the drawing).
- There must be plenty of loops and dead ends, like in b and c, and also links between false paths (like d), all of these preferally early on the path.
- The maze should be difficult to solve backwards, by having false ending paths (like e). This criterion also tends to produce nicer-looking Viennese mazes, with a better balance of the different colors.
For the computer to be able to compare mazes and identify the most interesting ones we define scores which will quantify how well each of the criteria 1,2,3, are fullfilled by a given maze. For instance
The final score of a Viennese maze is given by the product
where the exponents reflect the relative importance that we decide to attach to each criterion.
Evaluating this score on the states graph of a Viennese maze is easy: the existence and uniqueness of a solution can be checked using a simple-path-finding algorithm. Dead-ends are simply the nodes of the states graph with no descendents, and the loops of the maze correspond to the thin edges. The states graph itself and its different lines of nodes can be easily computed using Dijkstra’s efficient algorithm to find minimal paths between the start and the different states. The current Python implementation, relying on the Networkx package, enable to evaluate on the order of 1000 mazes per second (depending on their complexity).
Let’s grow mazes !
Now that we have defined how to score a Viennese maze, we will provide the computer with an uncolored canvas, and we will ask for a coloring (initial color of each traffic light) of this canvas that produces the best score possible :
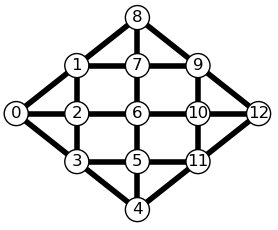
There are $3^{24}$ (almost three hundred billion) ways of coloring the 24 streets on this canvas, and considering all of them would be too long. But a great many of these colorings make interesting mazes, so we can just look semi-randomly for some of these.
An effective way to do so is to first colorize the canvas in a completely random way, then improve the coloring by repeating the following steps:
- Create a new maze by randomly changing just a few colors of the current maze.
- Compute the score of this new maze.
- If the new maze scores lower than the current maze, dump it, otherwise it replaces the current maze. Go back to step 1.
Here is a maze being optimized following this mutation/selection procedure (over 24000 mazes were generated, only the successive improvements are shown):

This algorithm can be refined using annealing (in which you first evaluate many different mazes before refining the search around the best one), or any fancier search strategy such as genetic algorithms, ant colonies… What works best is still an open question.
Try it at home
If you want to try and make your own Viennese mazes (using for instance you district as a canvas), I wrote a Python package called vmfactory which implements all the steps discussed above. It can generate two variants of Viennese mazes: one where passing through the same light twice in a row is forbidden, and one where it isn’t (algorithmically, the only difference is the way the states graph is computed).
In the following example, we generate a squared canvas, we initialize a maze with random colors, optimize it, and generate a report (maze/graph/solution):
1 2 3 4 5 6 7 8 9 | |
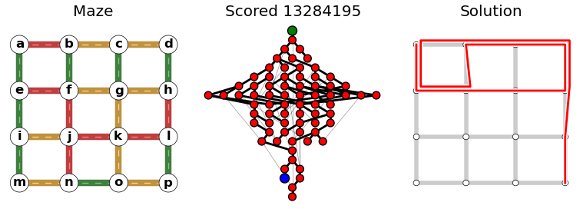
The package is based on Networkx, Numpy and Matplotlib. The code is rather short (most of it serves to draw fancy graphs !), and modular : you can easily change the rules, change the way the score is computed, change the optimization procedure, or the way the reports are drawn.
Thank you for reading until there, and happy mazing !